The crucial role of visualization in an industrial digital twin
Posted: November 11, 2025
The growing need to optimize faster in the face of environmental and economic challenges is transforming how we think of and interact with industrial equipment, systems, and processes. These constructs of data and analytics, known as a digital twin, are powerful tools, but their true potential can only be unlocked with effective data visualization.
Let’s explore the essential role of data visualization in a digital twin and how it transforms raw data into actionable insights.
What is the relationship between data visualization and digital twins?
An industrial digital twin is a virtual, digital replica of a physical asset, system, or process. It's a dynamic, living model composed of real-time data values, structures and relationships associated with its physical counterpart, allowing for continuous monitoring, analysis, and simulation. The goal is to understand and predict the behavior of the physical asset, system, or process without needing to physically interact with it.
Data visualization, on the other hand, is the graphical representation of information and data. It uses visual elements like charts, graphics, maps, documents, and even dashboards to contextualize complex data sets into understandable information. It's the bridge that connects the abstract world of data values and distant systems to the human mind, enabling quick comprehension and informed decision-making.
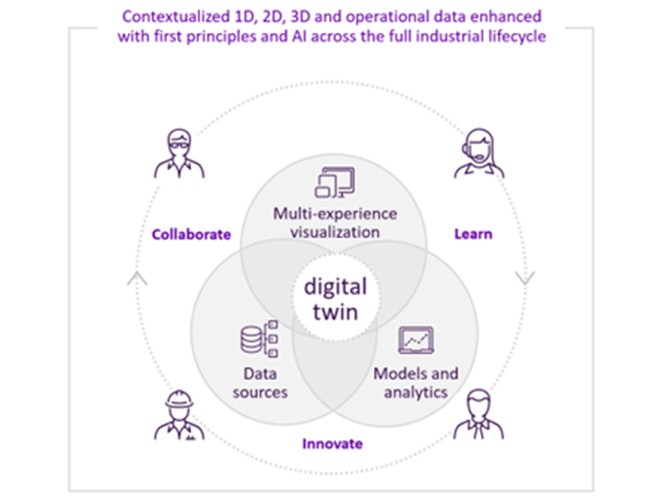
An industrial digital twin assembles a massive amount of data, gathered from equipment sensors, calculated metrics, authored documents, schematics and 3D models. Without a way to make sense of this data in combination, the digital twin is just a sophisticated data repository. This is where data visualization is crucial.
Effective data visualization transforms the digital twin from a data repository into an interactive, insightful tool. It turns streams of numbers into a visual narrative, allowing users to see patterns, identify anomalies, and understand relationships that would be invisible in a spreadsheet. This synergy is what makes an industrial digital twin a powerful decision-support system that can gaze holistically into the past or project performance into the future.
What challenges does data visualization solve in a digital twin?
A digital twin is not complete without data visualization to help aid understanding and interpretation. Here are four ways data visualization supports a digital twin:
- Accessibility – It simplifies the method of accessing your data in one place. Users don’t need to bother with logging into servers, dealing with the clutter of data tables, viewing permissions, or searching between archives for the right source. Its native integration to the data repository underpinning the digital twin makes it easy to get to your data and use it.
- Organization – It brings order to the chaos of industrial data. When working with large volumes of time-series data, events, metadata, 3D models and more, getting a handle on what you have can be challenging. Data visualization normalizes how your digital twin data is represented, leveraging existing hierarchies and relationships to reduce the effort required to create meaningful visualizations.
- Extrapolation – It accelerates analysis through context and makes it easy to share your findings. Context is a powerful amplifier of industrial data that brings superior levels of understanding to drive specific action. This allows users to visualize the asset, system, or process in its environment, and the internal and external effects upon it that may impact performance. In this way data visualization as part of a digital twin transforms the complexities of your data into insights not easily seen before.
- Flexibility – It tailors visualizations to be meaningful for a diverse audience. Organizations have a spectrum of users, from operators to executives, and each role requires a distinct view of the data. A high-level summary dashboard, for instance, isn't enough for an operator. Likewise, a standard process display won't help an engineer diagnose a recurring problem. Not every data visualization will—or should—meet every need. Having the flexibility to curate as required drives greater adoption and impact of the digital twin.
The future of data visualization for digital twins
Data visualization is not just an add-on; it is the essential decision point of a digital twin. It reveals the capacity behind the virtual replica, turning it from a data-heavy construct into an intuitive, powerful tool for analysis, prediction, and decision-making. Useful for amplifying the outcomes from predictive maintenance and anomaly detection, performance optimization and simulation, and advancing your situational awareness.
As industrial digital twins become more prevalent, the art and science of data visualization for different use cases and user types will become even more critical to unlocking their full potential. The future of data visualization for digital twins is incredibly exciting.
Related blog posts
Stay in the know: Keep up to date on the latest happenings around the industry.