With Experiences, you can now create advanced data visualizations in CONNECT
Posted: July 15, 2025
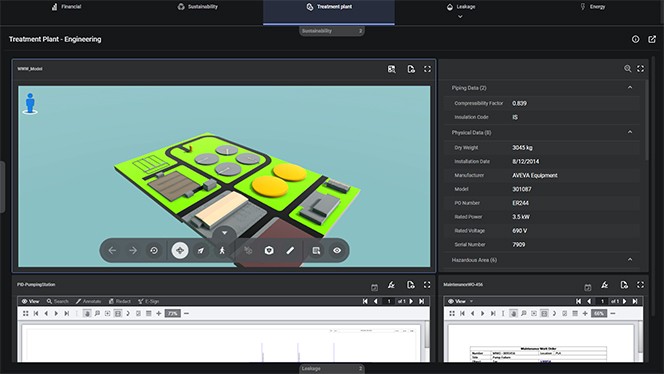
Effectively visualizing diverse industrial data means you must sometimes go beyond bar charts and pie charts. Effective industrial data visualization combines maps, diagrams, documents, trends, and a variety of graphical elements that suit the types of users and use cases you have.
To meet the growing need for advanced data visualizations that communicate the data diversity that exists within industrial environments, we created Experience visualizations in CONNECT. This new interactive tool enables you to visualize dynamically driven content, advanced visualization functions, and deep customization. These structured views give you the flexibility you need to design the visualizations you want, including layout, size, aspect ratio, colors, navigation and menu interactions, and content mix, among other options.
 Visualizations your way: Quickly and easily decide what you want to see.
Simplified design, deeper results
While learning to use another tool can often feel cumbersome, we created Experience Designer to simplify the process of assembling Experience visualizations. Experience Designer is an intuitive, easy-to-use tool—regardless of job role and skillset. With WYSIWYG (what you see is what you get) editing, you can choose any available content (including existing visualizations) to embed in a customizable pane-based layout—and quickly get on the path to deeper, richer visualizations.
Enterprise and role-based visualizations made possible
Thanks to Experiences, CONNECT users now have access to enterprise and role-based visualizations, aiding users in delivering expansive enterprise visualizations that showcase current and projected performance across multiple sites, divisions, or fleets of assets. What’s more, Experiences supports diverse teams tasked with troubleshooting and analytical support activities with persona-based visualizations that help facilitate visibility and resolution of complex issues.
Are you ready to create more robust visualizations with Experiences? Learn more about CONNECT visualization.