Smart data solutions for smart energy-efficient buildings
Posted: August 06, 2025
It takes a lot of energy to keep buildings operational—to keep the lights on, the temperature comfortable, the water running. Globally, the operation of buildings makes up 30% of global energy consumption and 26% of energy-related emissions.[1]
Companies with large or complex infrastructure such as universities and medical facilities face unique challenges. For such organizations, energy use management is crucial to the important work they do, work that often relies on strict operational parameters to further research, save lives, and educate people. In addition to pressure from ESG regulations, such organizations often have sustainability and net-zero energy goals built into their organizational mission. But these organizations also need cost-effective solutions that will allow them to continue doing their important work.
A centralized data platform for visibility across systems
Organizations must understand how different systems work within and across buildings and gain insight into how best to operate these systems efficiently to achieve their energy goals as cost-effectively as possible. But it’s not enough to simply collect data about HVAC systems. Increasingly, such organizations are managing sustainable energy assets such as wind turbines and solar farms to offset and complement energy use, which adds more layers of complexity with intermittent sources and grid integration challenges.
These organizations need a centralized data platform that collects data from disparate systems across buildings and assets, automates tasks, optimizes operations, and makes data securely accessible to a range of users. As the U.S. Department of Energy states, “To drive action, energy use must be correlated with assets and activities in the buildings and all of this information must be available in the right form to the right people at the right times.”[2]
Following are three organizations doing just that, using intelligent data solutions to get actionable information in the hands of the people who need it.
Stanford upgrades its control system with a robust integrated data solution
Stanford’s Central Energy Facility uses heat recovery, thermal storage, and system optimization to achieve sustainable energy production and delivery to the entire Stanford community—over 250 major buildings, including labs, classrooms, and dormitories.
A couple of years ago, Stanford’s power plant needed to double its cooling capacity, which required an upgrade to its control system. The team could upgrade their existing direct digital control system (DDC), but they needed more reliability—the main controller that runs the plant had shut down five times in five years. So they chose instead to implement a centralized PLC powered by AVEVA™ System Platform that controls the entire plant. Not only was this solution less expensive than upgrading the existing DDC system, the new integrated solution could be operated and optimized centrally and remotely.
The new system allows all of Stanford’s energy equipment—including 3 heat recovery chillers, 2 chill water thermal energy storage tanks, 8 chillers, 18 cooling towers, 3 hot water generators, and over 30 pumps—to be managed together. Visualizations in AVEVA™ PI Vision™ enable any user to access the operational data and understand what actions to take based on what they see. So far, Stanford’s Central Energy Facility has seen an 80% reduction in water waste, achieved net-zero electricity use—it produces more electricity in its solar generation fields than it uses—and the new system hasn’t shut down once.
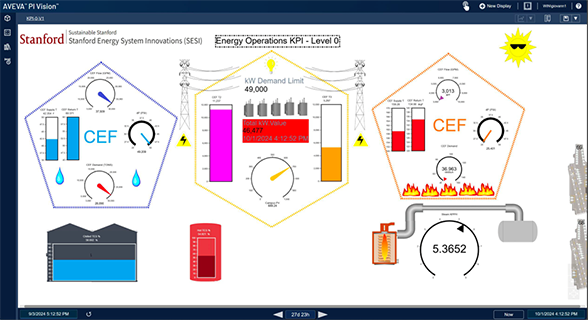 Users can get an overview of how key equipment and systems are running with eye-catching visualization dashboards, with the ability to drill down more granularly as needed.
The interoperability of AVEVA System Platform makes it easy for the team at Stanford to integrate other tools and systems as needed, now and in the future. As Giovanni Alvarez, a mechanical engineer for Stanford’s Central Energy Facility, says, “DCSs lock you into one brand, and now you’re buying gold-plated equipment. [AVEVA PI System] doesn’t care what you’re using. It’s just there to ingest data. It can speak [to] whatever it needs to.”
Overall, Stanford’s Central Energy Facility has increased reliability of its systems to more than 99%.
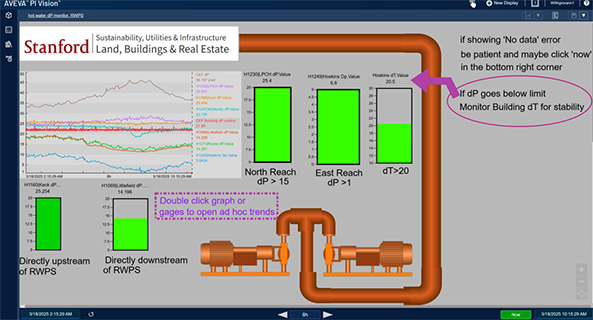 Visualization dashboards offer crucial at-a-glance information about how systems are performing, with information about actions to take.
Reducing Scope 1, 2, and 3 emissions with a smart data platform
Renewable energy sources such as fuel cells, solar, and wind enable companies to operate more efficiently and cut costs while reducing their carbon footprints. But a lack of digitization, data availability, and standardization makes managing these resources difficult, especially given that different vendors often use disparate systems.
Multiple renewable energy sources managed by different vendors often lead to data silos. It becomes extremely challenging to conduct data analysis when there are six or seven different energy streams that need to be integrated in one place.
With 35 MW of fuel cells, 60 MW of solar, a dozen or so battery installations, and several micro-grids, one major healthcare provider had many on-site renewable energy sources, but little ability to track how they were all performing. DERNetSoft, an energy resource management solutions provider, helped centralize and visualize the healthcare provider’s energy data with the help of CONNECT data services.
This data platform enables the healthcare provider’s energy team to track electricity and gas usage across hundreds of buildings, which helps the small team of four better manage an energy footprint equivalent to a small city, leading to millions of dollars in savings and more sustainable operations.
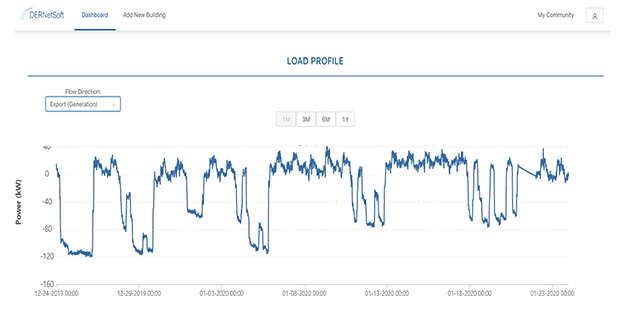 This dashboard shows energy production from fuel cells, indicating an excess of net metering on the weekends.
SNOLAB hunts for dark matter with a central data platform
Two kilometers underground, in an active nickel mine in Canada’s Sudbury Basin, scientists conduct groundbreaking experiments in astroparticle physics. SNOLAB is the deepest, cleanest lab in the world. Its depth provides a low-radiation environment ideal to study dark matter and neutrinos, where scientists explore our most pressing questions about the universe. The lab hosts over one thousand academic collaborators from over twenty-four countries. It’s where Dr. Art McDonald proved neutrinos have mass, a discovery for which he won the Nobel Prize in physics.
Power keeps all SNOLAB’s critical infrastructure running—chillers, compressed air, HVAC systems—so that the experiments can keep running. Using AVEVA™ PI System™, teams can see exactly when the power is interrupted. For instance, SNOLAB’s Underground Ultra-Pure Water plant, which re-circulates ultra-pure water to the SNO+ experiment. If the power is interrupted, it triggers an alarm and a notification is sent to the on-call managers that this piece of critical infrastructure has gone down.
Much of the equipment that scientists use at SNOLAB is on a local uninterruptible power supply (UPS), so when the power goes out, systems automatically switch over to battery power until the generators kick on. Historically, SNOLAB had to make an educated guess when it came to deciding how much backup power systems needed. Now, the team can reconstruct power outages to see exactly how much backup power was needed, which allows them to design appropriate bridging power.
When the lab’s Helium and Lead Observatory (HALO), a supernova neutrino detector, switched to backup power, the team was able to reconstruct the event and see that the bridging power required was about seven minutes, as opposed to the 30 minutes they’d previously hypothesized. This information ultimately saved them 66% in UPS costs and saved valuable space in the lab. It also allowed operations to validate the system designs and collect trends to address future potential problems before they occur.
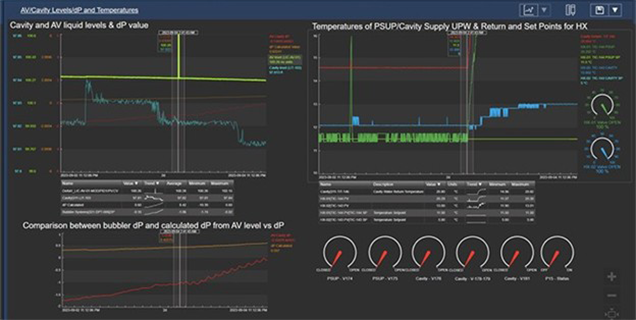 AVEVA PI Vision allows scientists to monitor the SNO+ experiment no matter where they are located.
How real-time data drives smart building sustainability
Smart data solutions are helping organizations overcome the challenges of managing energy use and system performance across vast infrastructures. By unifying diverse data streams and enabling real-time insights, organizations can capitalize on opportunities to operate more sustainably, ensure they’re meeting ESG goals, and execute their core missions as efficiently as possible. As energy demands rise and expectations for sustainability grow, the ability to turn data into action becomes even more critical. With the right digital tools, smart buildings are not only possible—they’re already here, and they’re making a measurable difference.
Learn more about the data science behind smart, sustainable, high-performance buildings.
Related blog posts
Stay in the know: Keep up to date on the latest happenings around the industry.