Simplify how you visualize and share your data
Create visualizations and dashboards with data from CONNECT and third-party sources, using easily customizable templates and rich tools

Create visualizations and share across your organization
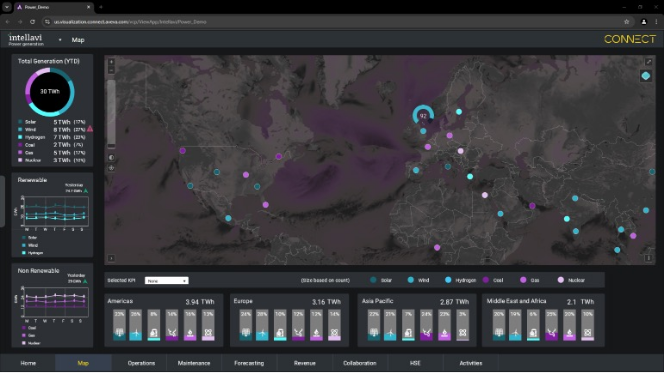
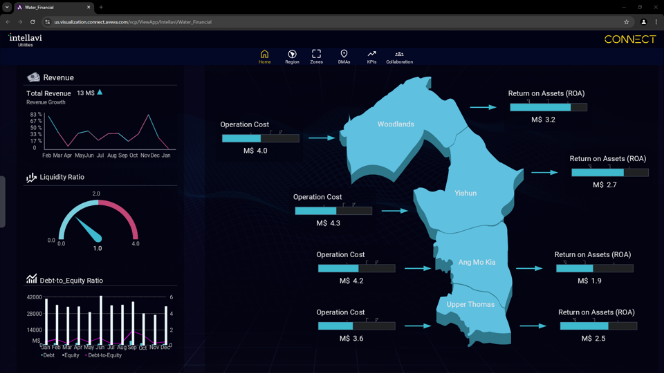
View performance across multiple sites, divisions, or fleets of assets in a centralized, graphical interface. Easily interpret KPIs and business data with graphs and charts.
Role-based views
Drill down into the information with tailored visuals for different roles to gain performance intelligence.
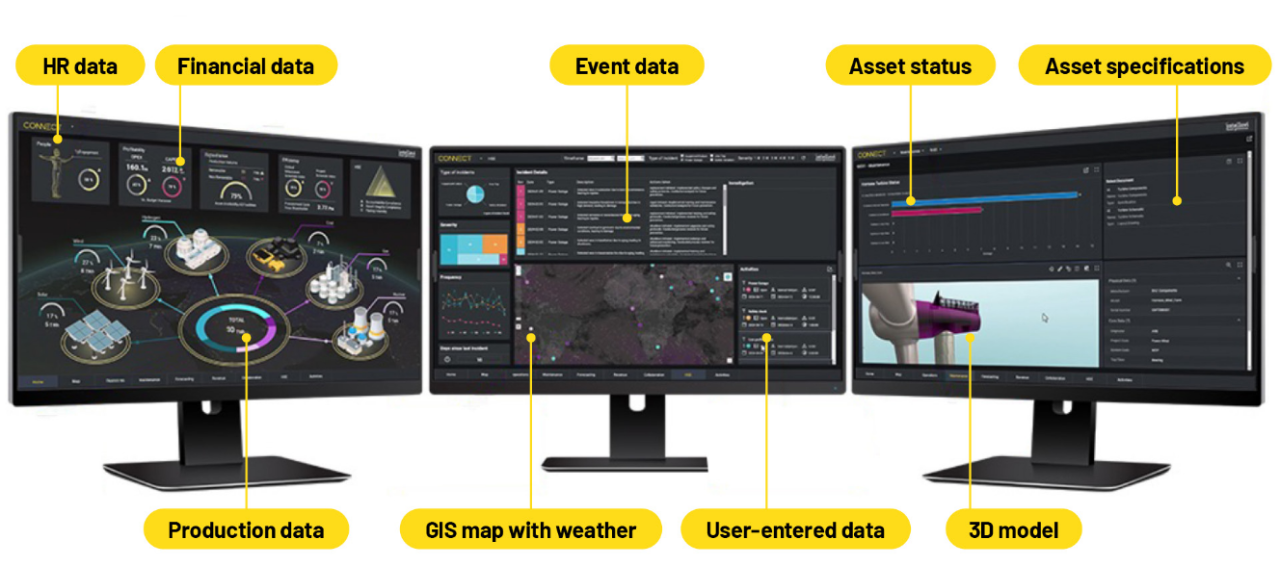
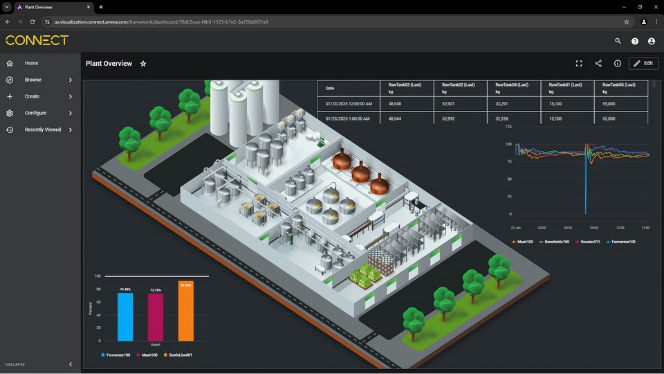
Production and asset-based visualizations
Visualize production details to drive optimum performance across linked assets. Or focus on a single asset to gain insights into performance and maintenance. Utilize data types such as time series data, metadata, 3D models, GIS and maintenance data.
Designed specifically for industrial data
Utilize data from CONNECT and AVEVA Asset Information Management, as well as other sources, and visualize it in multiple engaging formats dependent on your needs
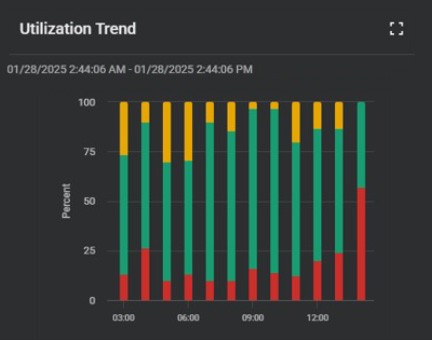
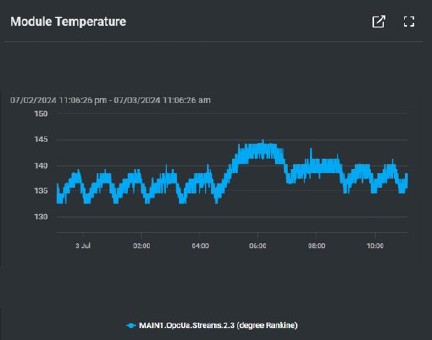
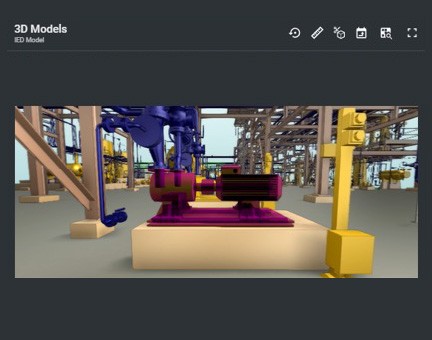
Choose from charts, graphs, 3D viewers and many more types
Visualization features in CONNECT
Visually relate data
Easily define and deploy flexible browser-based visualizations that show complex relationships and data-driven insights.
Multiple visualization formats
Choose from Grid, Canvas, or Experience formats to craft your own visualizations. Customize what you want to see.
Meet unlimited role-base needs
With a unique flexibility for surfacing industrial information, you can assemble visualizations for different use cases and specific role-based needs
Bring operations, engineering and business data together
Data is provisioned from CONNECT and third-party sources to populate visualizations with charts, graphics, and other content.
Industry relevance
Apply domain-specific use cases and industrial capabilities that enable teams to drive critical action quickly.
Designed for industrial data
Available for time-series data, event and asset efficiency data, 3D models, documents and more.
Leverage our generative AI chat tool Industrial AI Assistant
Ask questions about your data and get instant insights
FAQs
CONNECT data services is the primary data source for populating CONNECT visualization dashboards.
Industry Accelerators are partially assembled analytics visualizations built using CONNECT platform services.
They combine several industry use cases created by our services team to accelerate time to value using CONNECT. The visualizations and supporting analytical calculations and models are completed using customer-supplied data and customization choices.
Purchase CONNECT capabilities through AVEVA™ Flex, a simple, credits-based subscription model that spans any mix of cloud, hybrid, and on-premises solutions across the AVEVA portfolio. You are in control with a pay-as-you-use approach that allows you to easily monitor and scale your solution set.
Find answers to your technical questions and learn how to set up and configure visualization through our user documentation portal.