Optimize operations and OEE using process analytics
AVEVA Insight gives you easy access to actionable information in the cloud. Its no-code, self-service, fit-for-purpose analytics work for ordinary operations users—not just data scientists.
Teams can collaboratively manage operations and assets in the cloud—from anywhere, at any time. AI infused software helps you optimize plant performance and prioritize maintenance. Process optimization analytics can help predict quality, energy efficiency, uptime, throughput, asset reliability, and asset life.
AVEVA Insight offers the fastest and simplest way to make your operations more agile and resilient. Lower your IT costs, grow sustainably, and uncover new possibilities.
Unlock critical data and make it accessible from the cloud
Support the connected worker and increase collaboration
Drive operational performance and improved asset reliability
AVEVA Insight at a glance
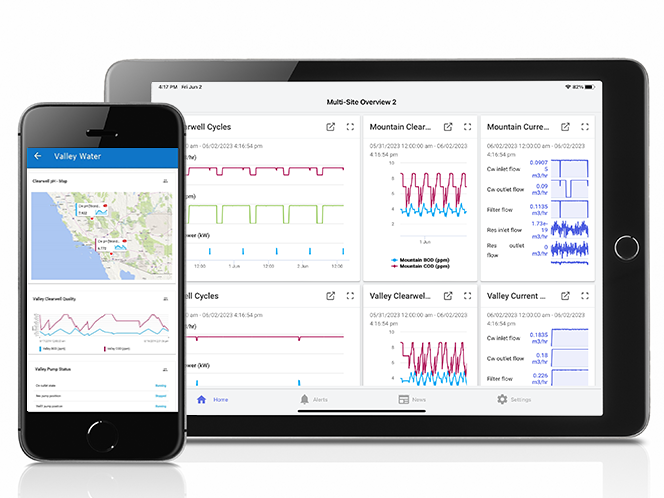
- Secure access from any location or device
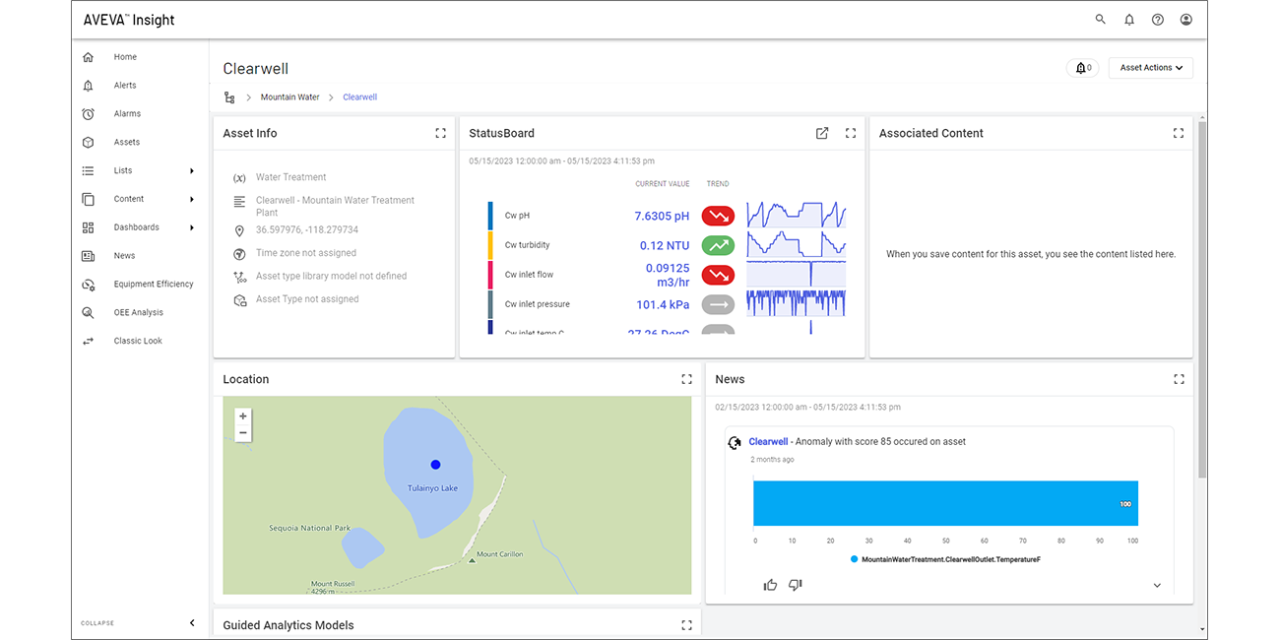
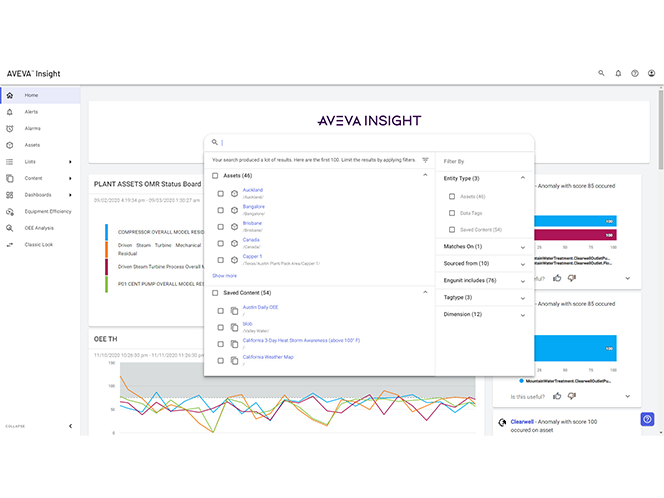
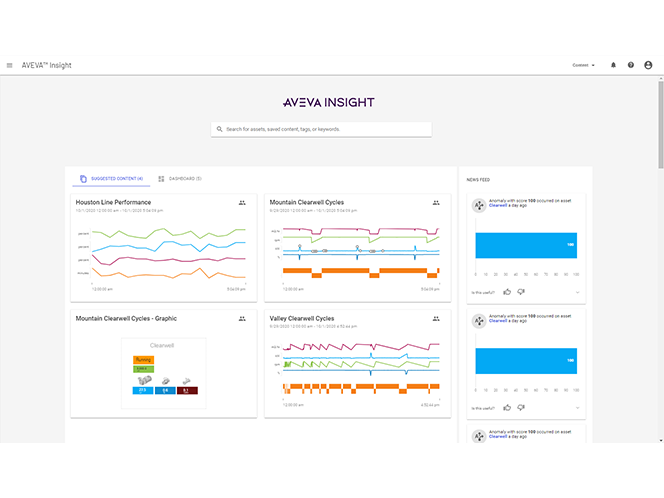
- Search-based navigation, time-series charts, process graphics, geolocation, and customizable dashboards
- Utilization and efficiency analysis, condition management, and alerts and notifications
- Automated analytics using unsupervised machine learning
- Connectivity to AVEVA’s HMI/SCADA products, 18 industry-standard drivers, and REST API
- Designed with security in mind. Learn more about AVEVA security (link: https://trust.aveva.com)
Data and analytics in the cloud
Make better and faster data-driven decisions with complete visibility of your operations and asset performance data at your fingertips. Accelerate results and scale more efficiently with a single digital thread throughout your organization that enables different departments to work together seamlessly.
AVEVA Insight is both vendor- and system-agnostic. It has built-in publishers to AVEVA’s HMI/SCADA products and native connectivity to 18 industry-standard drivers. AVEVA Insight connects all your asset, operational and production data through one digital thread.
AVEVA Insight is not just for data collection and storage. It applies context to data and provides sophisticated analysis capabilities for users of all levels and experience. It’s a powerful system for immediately and easily accessing asset information and KPIs in a secure cloud environment.
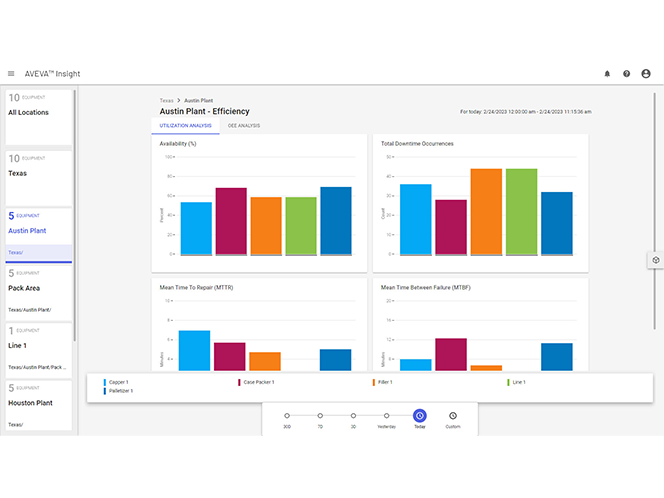
Standardize OEE visibility and increase utilization and efficiency. Easily identify areas for continuous improvement with root-cause analysis.
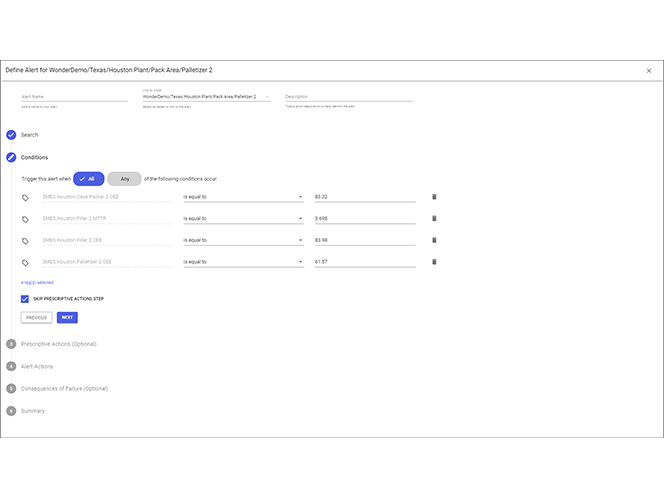
Use customizable asset-data conditions and action triggers to configure alerts. Manage mobile app and desktop notifications.
Fit-for-purpose algorithms combined with prescriptive actions let you make AI-infused analytics a regular part of operations oversight.
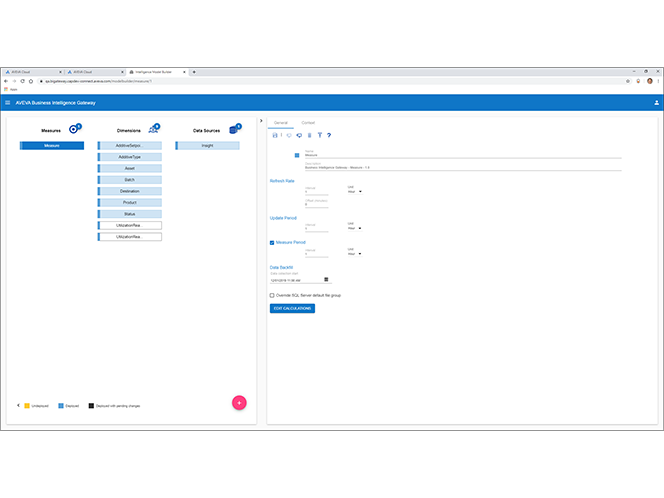
Automate the extraction, transformation, and storage of operational KPIs and related information with enterprise manufacturing intelligence (EMI).
Alleviate your IT burden
With AVEVA Insight, you enjoy seamless, automatic updates and cloud scalability for your business needs. Our cost-effective subscription model eliminates the need for additional investment in hardware servers and software. Leave the IT burden of managing your system to us, so that you save time, money, and worker hours.

Proven outcomes
Waterforce reduced time spent driving to remote assets, increased system performance visibility, and reduced energy costs by 50%.
Leggett & Platt improved collaboration across the business and identified improvement opportunities for unplanned downtime, OEE, and labor effectiveness.
Schneider Electric improved productivity of all lines, increased operational efficiency by 12%, and reduced equipment downtime by 44%.
Ballard used closed-loop remote monitoring and optimization and improved reporting transparency of contractual obligations.
AVEVA Insight resources
Discover latest news and resources
Check out the latest news, blogs, events, webinars, and success stories.