Are you an AVEVA™ PI System™ customer? Learn how your data can ensure reliable, profitable and sustainable operations.
Visit the dedicated hub.
What is Asset Performance Management?
Asset performance management (APM) software monitors assets to identify, diagnose, and prioritize impending equipment problems – continuously and in real time. APM empowers organizations to reduce unscheduled downtime, prevent equipment failure, and reduce maintenance costs while increasing asset utilization, extending equipment life, and identifying underperforming assets. Maximize profitability and improve performance with AVEVA APM solutions.
APM features
Transform assets from cost centers into revenue drivers.

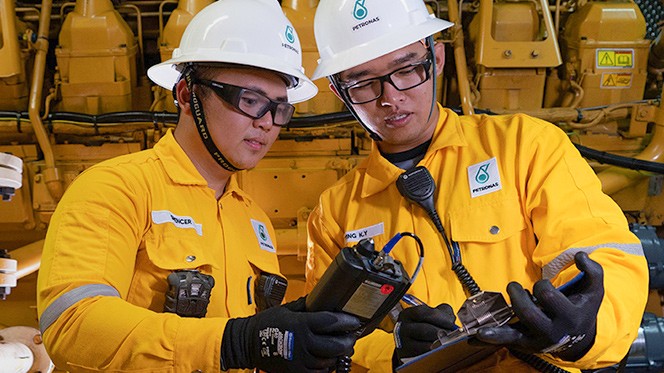
PETRONAS saves $17.4M and boosts ROI x14 in year one using AVEVA APM
Petronas did more than reduce downtime at its onshore and offshore facilities—it avoided 51 lost time incidents in a single year using cloud-based AVEVA APM solutions.
AVEVA Asset performance management
Get the tools you need to exceed your reliability, safety, and sustainability goals.
AVEVA Asset Strategy optimization
AVEVA Asset Strategy Optimization enables a risk-based asset strategy for optimal performance, understanding critical assets, failure behavior and mitigating actions
AVEVA Predictive Analytics
Formerly Known As PRiSM Predictive Asset Analytics
End unplanned downtime and reduce maintenance costs with accurate asset health information that improves operating efficiency and resilience
AVEVA™ Advanced Analytics
Maximize production efficiency, improve quality, energy efficiency, and throughput with cloud-based predictive and prescriptive insights.
AVEVA Mobile Operator
Formerly Known As IntelaTrac Mobile Operator Rounds
AVEVA Mobile Operator software combined with mobile devices improves operations efficiency, streamlines maintenance management, and increases regulatory compliance visibility.
AVEVA Operational Safety Management
AVEVA Operational Safety Management enables asset operators to eliminate, minimize, or mitigate operational risk while optimizing asset performance.
AVEVA BI Gateway
A unifying multi-dimensional information model to aggregate data from multiple sources and provide context for use with reporting/ dashboard tools. Improve plant performance in near real-time by enabling rich analytics in your BI tool on industrial data.
AVEVA™ Insight
AVEVA Insight delivers actionable information and Artificial Intelligence capabilities to help your teams improve asset reliability and operational performance.
Monitoring and Diagnostic Services
Reduce maintenance costs and capital expenditures with AVEVA Monitoring and Diagnostics Services Center. Find out more today!