How can you trust your operations data visualization?
Posted: March 29 2024
At AVEVA World 2023, Coromandel International, the leading fertilizer manufacturer in India, shared some of the issues it had with its previous operations data management platform. Since operations visibility was a key part of Coromandel’s digital manufacturing journey, the long list included several data visualization issues. Coromandel said that the previous platform’s overall user interface was below par in terms of user friendliness. Most notably, Coromandel described “insufficient, improper interfacing and communication problems.” For example, the previous platform’s frontend dashboard was displaying mismatched parameters from the back-end’s calculations.
Challenges with general-purpose data visualization tools in industrial environments
Many of the data visualization options on the market come from an information technology pedigree intended mostly for visualizing and reporting on transactional data, such as sales figures, financial records, customer interactions and other forms of structured data common to business and administrative contexts. These tools aren’t aimed at monitoring physical processes and equipment.
When using these tools in the dynamic environments of most industrial organizations, the kinds of issues Coromandel experienced can happen. For instance, data can change much more frequently in industrial environments. If the data between the backend and frontend are not synchronized in real-time, discrepancies can arise. Alternatively, there could be inconsistencies in the data transformation, cleansing, and validation processes within the data pipeline from the machines to the visualization tool. Or, if the systems aren’t designed to scale with increased data volume, it can lead to bottlenecks that cause delays and system timeouts. These kinds of issues are avoidable.
Avoid common data visualization issues with native integration to your operations data
Coromandel went through a rigorous process of qualifying various platforms on numerous criteria for its digital manufacturing project. Ultimately, Coromandel selected AVEVA™ PI System™, the market-leading operations data management solution, as the base data infrastructure for the project. Coromandel evaluated the AVEVA PI System portfolio as fulfilling all the manufacturer’s criteria. The manufacturer provided several reasons for selecting AVEVA PI System, including:
- Scalability: It “can handle large amounts of data and can easily scale up to meet the growing data needs.”
- Real-time data collection: It “allows organizations to make quick and informed decisions based on the most current information.”
- Data quality: It “ensures data consistency and accuracy.”
- Data Security: It “provides robust security features … ensuring the protection of sensitive data.”
With a real-time and scalable system, you can handle the high-frequency data required in industrial environments, and you can avoid bottlenecks. With a system designed for data quality, you don’t have to worry about inconsistencies. You avoid the kinds of issues Coromandel encountered with its previous platform. If your data visualization tool natively integrates with your secure operations data infrastructure, then everyone across the enterprise can trust the data when they access it.
Visualizing trusted, real-time, and high-quality operations data with a secure, scalable solution
With native integration to AVEVA PI System, AVEVA™ PI Vision™ is the fastest, easiest way to visualize AVEVA PI System data. It is tailored for the unique, critical environments of industrial organizations. Because rapid responses can be the difference between operational continuity and costly disruptions, AVEVA PI Vision users can seamlessly navigate and easily use crucial, real-time, and context-rich data.
As operational visibility was a key part of Coromandel’s project, the manufacturer used AVEVA PI Vision to provide data access to all its staff, from the enterprise level to the plant level. Because the industrial workforce consists of staff from all technical levels, AVEVA PI Vision enables users to quickly configure displays and share insights without programming. They can rapidly explore and compare critical event information to make swift decisions. They can build reusable displays for understanding operations and conducting on-the-fly monitoring and investigation of assets and process events. Users can build asset-based displays that offer a consistent, real-time view of critical information across hundreds of assets and multiple sites.
Coromandel’s AVEVA PI Vision displays include dashboards for plant-level staff, plant superintendents, as well as those for heads of production and executives. Coromandel tailors its AVEVA PI Vision displays to the requirements of different roles in the organization.
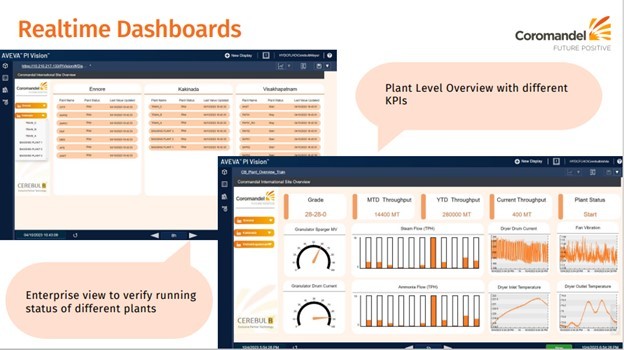
For example, Coromandel shared the two above AVEVA PI Vision displays that it built for the head of production. The top display provides a high-level view of the running status of different plants within the enterprise. The bottom display provides a more detailed view of specific KPIs at the plant level, including product grade, month-to-date throughput, year-to-date throughput, current throughput, plant status, and various performance symbols representing flow rates, temperatures and equipment vibration levels. These displays enable the head of production at Coromandel to quickly assess the operational status and performance of the plants in real-time.
If you’d like to learn more about how AVEVA PI Vision provides real-time operations data visualization and empowers data users throughout the industrial world, check out our on-demand webinar, “Visualizing operations across the enterprise: How self-service tools accelerate real-time insight.”
Related blog posts
Stay in the know: Keep up to date on the latest happenings around the industry.