Self-service data analytics with CONNECT visualization services
Posted: October 19, 2023
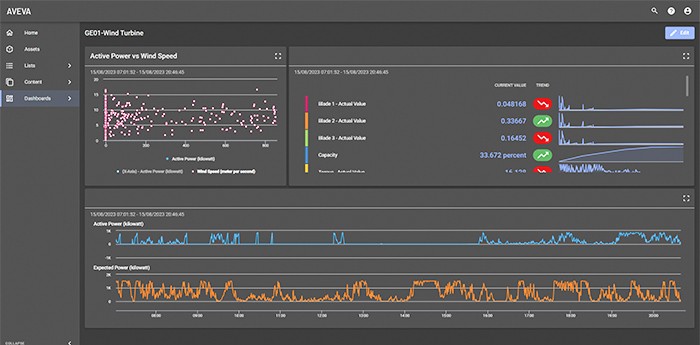
Customizable dashboards allow you to visualize your data using preconfigured and custom content for faster, more accurate decision-making.
Breaking down information silos
Information silos, data inconsistencies, and slow reporting are common problems that hold most businesses back. Traditionally, across industrial sectors, local teams were responsible for data access and management. They would spend a large amount of time collecting this information and collating it into a sharable format, from which off-site leaders can then make wider business decisions.
Industrial organizations that are ahead of the curve are adopting new ways of working, using the cloud to make reporting more accurate, faster, and accessible.
Delivering secure, reliable data access
As impending labor shortages loom large and the dynamics of modern workforces continue to shift, many organizations are moving to off-site work. Remote and virtual teams still require access to information generated on-premises, which can present cyber security, accessibility, and maintenance challenges.
Cloud-based applications provide seamless access to aggregated data
Cloud-based applications provide the ability to overcome data-gathering hurdles and aggregate and display information across locations globally. Diverse teams across operations, reliability, sustainability, and beyond can access the information that matters to them. The scalability of the cloud ensures a short time-to-value for initial deployment and the ability to grow systematically.
Benefit from enhanced visualization capabilities
With CONNECT visualization services you can access preconfigured, custom content to create dashboards for visualizing data within Connect data services (Data Hub) and beyond.
Enable faster and more accurate decision-making:
- Give your remote and virtual teams easy access to on-premises data, speeding up your reporting time and creating a feedback loop between local and virtual teams.
- Break down information silos by pulling in data through Connect data services (Data Hub) and third-party sources.
- Avoid common cybersecurity and maintenance challenges of industrial data access management.
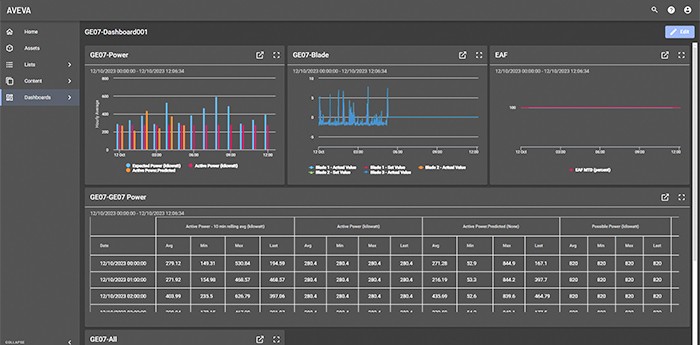
What can I do with CONNECT visualization services?
- Create dashboards for multiple use cases and visualization needs
- Assemble lists of assets and previously associated content for easy review
- Manage user creation permissions and access to each visualization type and individual dashboard
To find out more speak to a member of our team today.
Related blog posts
Stay in the know: Keep up to date on the latest happenings around the industry.